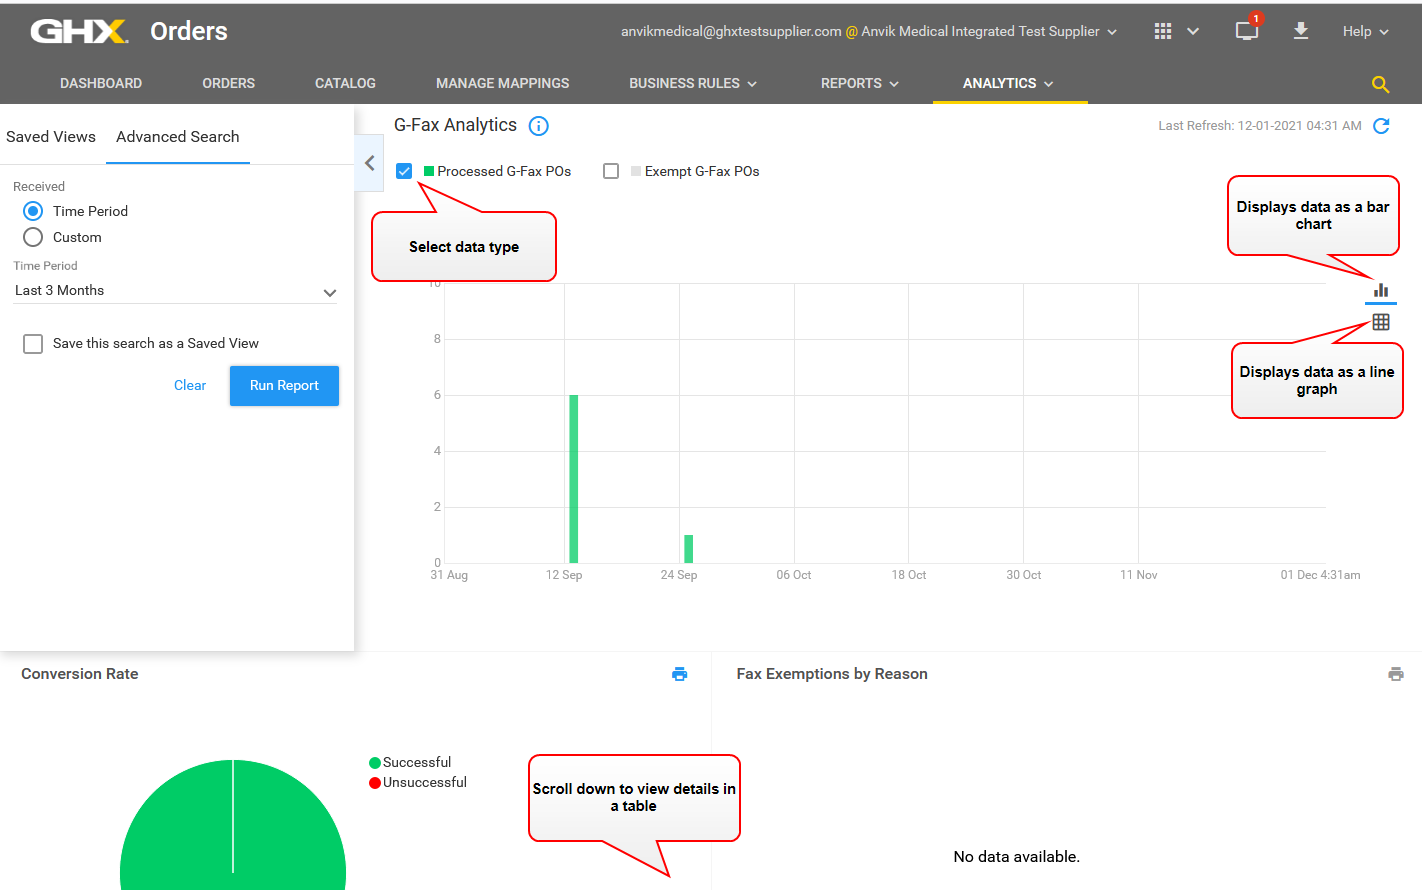
G-Fax Analytics: Processed G-Fax POs
| Column | Description |
|---|---|
| G-Fax PO Count | Contains the number of processed G-Fax POs for the selected time period. |
| G-Fax PO Count Trend, % |
Contains the trend of the number of G-Fax POs processed compared to the prior trend equivalent for the selected time period. A green up arrow indicates the number is increasing. A red down arrow indicates the number is decreasing. |
| Volume Count Trend, % |
Contains the volume count trend of G-Fax channel traffic, which includes POs and fax exceptions. Fax exemptions are non-converted documents. Examples of when exemptions occur are for transactional reasons, such as unreadable, non-order related, incomplete documents; and for order images that contain personal health or credit card information. |
| Average G-Fax POs per day |
Contains the G-Fax PO Count average divided by the number of days in the selected time period. |
| Average G-Fax POs per day Trend, % |
Contains the value in the Average G-Fax POs per day column compared to the prior trend equivalent for the selected time period. A green up arrow indicates the daily average is increasing. A red down arrow indicates the daily average is decreasing. |
| Average G-Fax PO Processing Time | Contains the G-Fax PO processing time divided by the number of days in the selected time period. |
| Average G-Fax PO Processing Time Trend, % |
Contains the value in the Average G-Fax PO Processing Time column compared to the prior trend equivalent for the selected time period. A green down arrow indicates the time is getting shorter. A red up arrow indicates the time is getting longer. |
![]() Click the icon to watch a video about this topic.
Click the icon to watch a video about this topic.