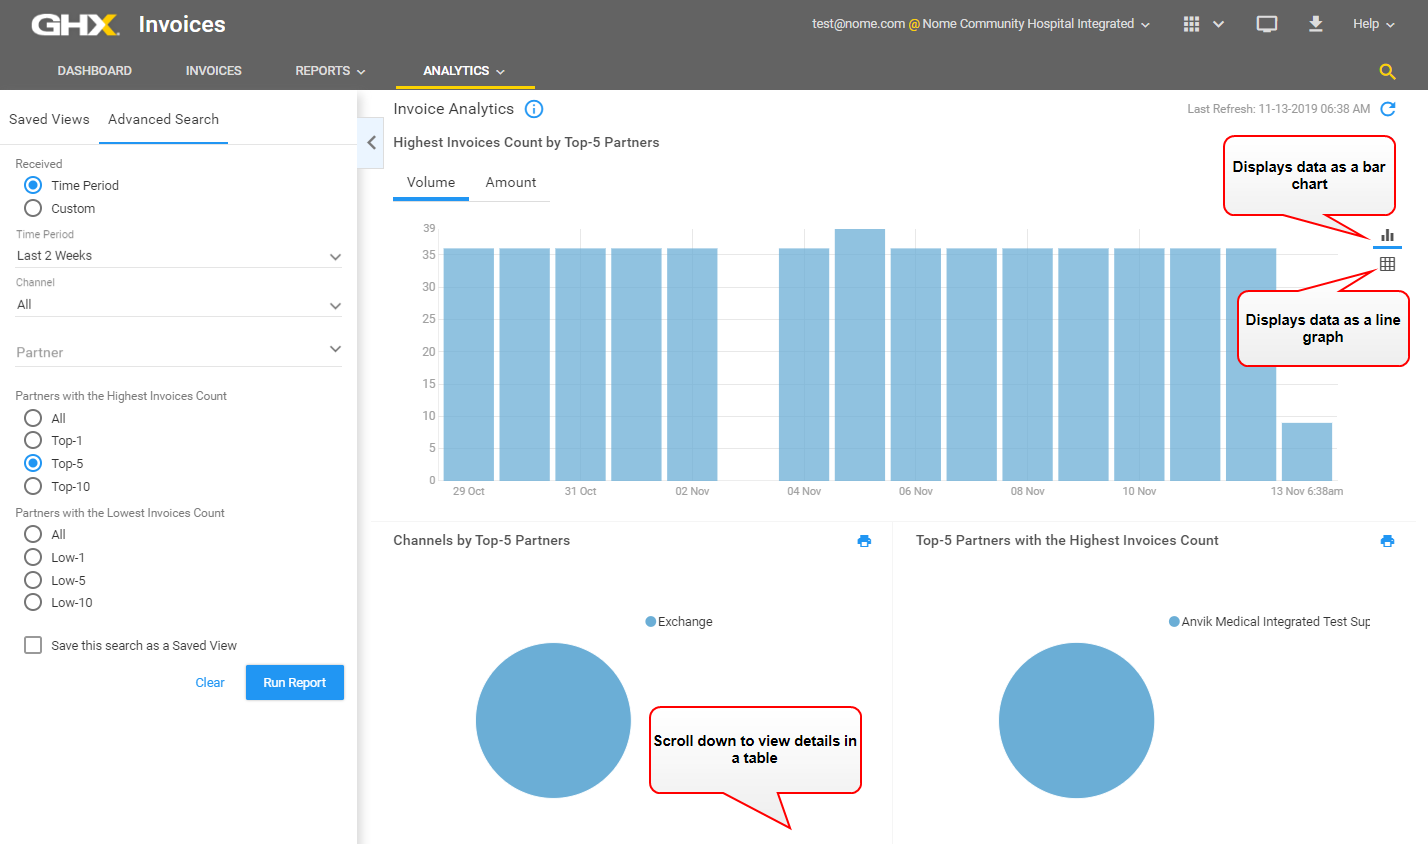
Invoice Analytics
The following table contains descriptions of the available data.
| Column | Description |
|---|---|
| Partner Name | Contains the trading partner name. |
| Invoice Volume Count | Contains the total number of invoices for the selected time period. |
| Volume Count Trend, % |
Contains the trend of the volume in the Invoice Volume column to the prior trend equivalent for the selected time period. A green up arrow indicates the volume is increasing. A red down arrow indicates the volume is decreasing. |
| Invoice Share for a Partner, % | Contains a breakdown of the percentage each trading partner has of the total invoice volume. |
| Total Invoice Lines | Identifies the total number of invoice lines included in the Invoice Volume Count column. |
| Invoice Lines Trend, % |
Contains the trend of the volume in the Invoice Lines column compared to the prior trend equivalent for the selected time period. A green up arrow indicates the volume is increasing. A red down arrow indicates the volume is decreasing. |
| Total Invoice Amount/Billing | Contains the total dollar amount of the invoice volume for the selected time period. |
| Invoice Amount Trend, % |
Contains the trend of the value in the Total Invoice Amount/Billing column compared to the prior trend equivalent for the selected time period. This allows provider accounts payable (AP) users to monitor spend analysis and trends with their trading partners. A green up arrow indicates the amount is increasing. A red down arrow indicates the amount is decreasing. |
| Delivery Status, % |
Contains the volume broken out across the following invoice statuses:
|