Orders Dashboard Page
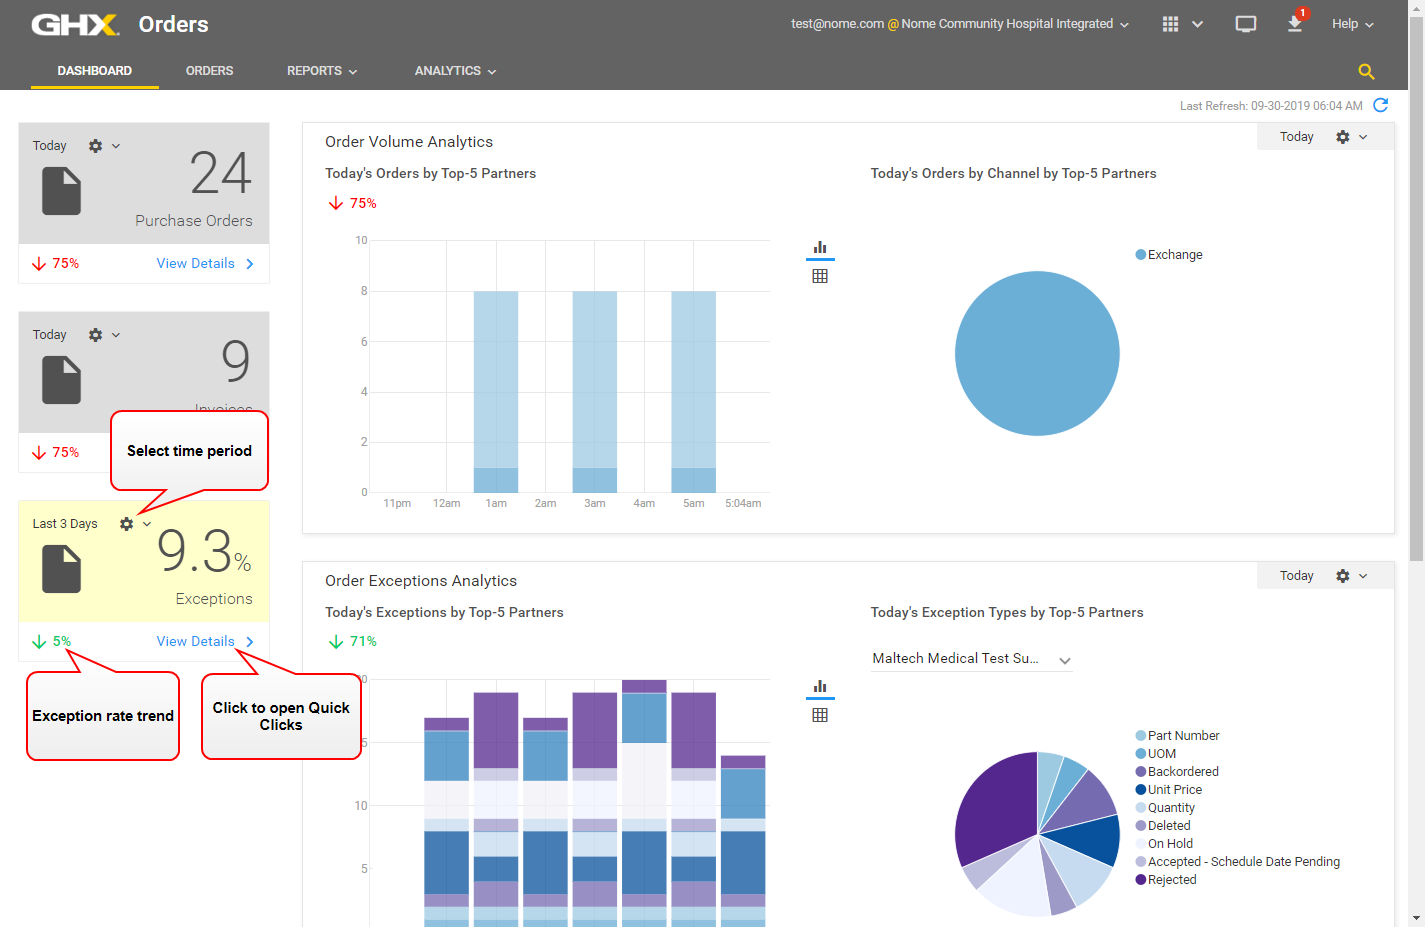
Click the solution selector ![]() icon and select Orders to open the Dashboard page. Use this page to view up-to-the-minute key performance indicators (KPIs) and analytics to quickly see the performance of your organization’s order volume and exceptions.
icon and select Orders to open the Dashboard page. Use this page to view up-to-the-minute key performance indicators (KPIs) and analytics to quickly see the performance of your organization’s order volume and exceptions.
Note: You can change the application's landing page by editing your preferences.
The following panels are on the left.
| Panel | Description | Click View Details to... |
|---|---|---|
| Purchase Orders | Displays the purchase order volume and identifies the percentage increase or decrease | Open the Orders page |
| Invoices | Displays the invoice volume and identifies the percentage increase or decrease | Open the Invoices page |
| Exceptions | Displays your organization’s transaction exception rate and identifies the percentage increase or decrease | Open the Orders page and select the Pending Exceptions Quick Click |
Click the ![]() icon on a panel to select a time period. Options are Today, Yesterday, Last 3 Days, Last 7 Days, Last 2 Weeks, Last 30 Days, and Last 3 Months.
icon on a panel to select a time period. Options are Today, Yesterday, Last 3 Days, Last 7 Days, Last 2 Weeks, Last 30 Days, and Last 3 Months.
Scroll right to view the following trend data.
- Order Volume Analytics – Shows graphs containing order volume and status
- Order Exceptions Analytics – Shows graphs containing exception volume and exception types by top-5 partners
- Contract Performance Analytics – Shows graphs containing data related to contract validated line count
The Dashboard key performance indicators (KPIs) may not match the totals on the Orders page for these reasons:
- The KPIs do not include purchase orders that were terminated due to failed delivery
- Purchase order transactions with the POA/ASN/Invoice with no matching PO status in Quick Clicks are not included in the KPIs
- All Orders numbers include PO counts for "ghost" supplier response-based POs (examples are POA with no matching PO, ASN with no matching PO, and invoice with no matching PO)