| Non-File Spend $
|
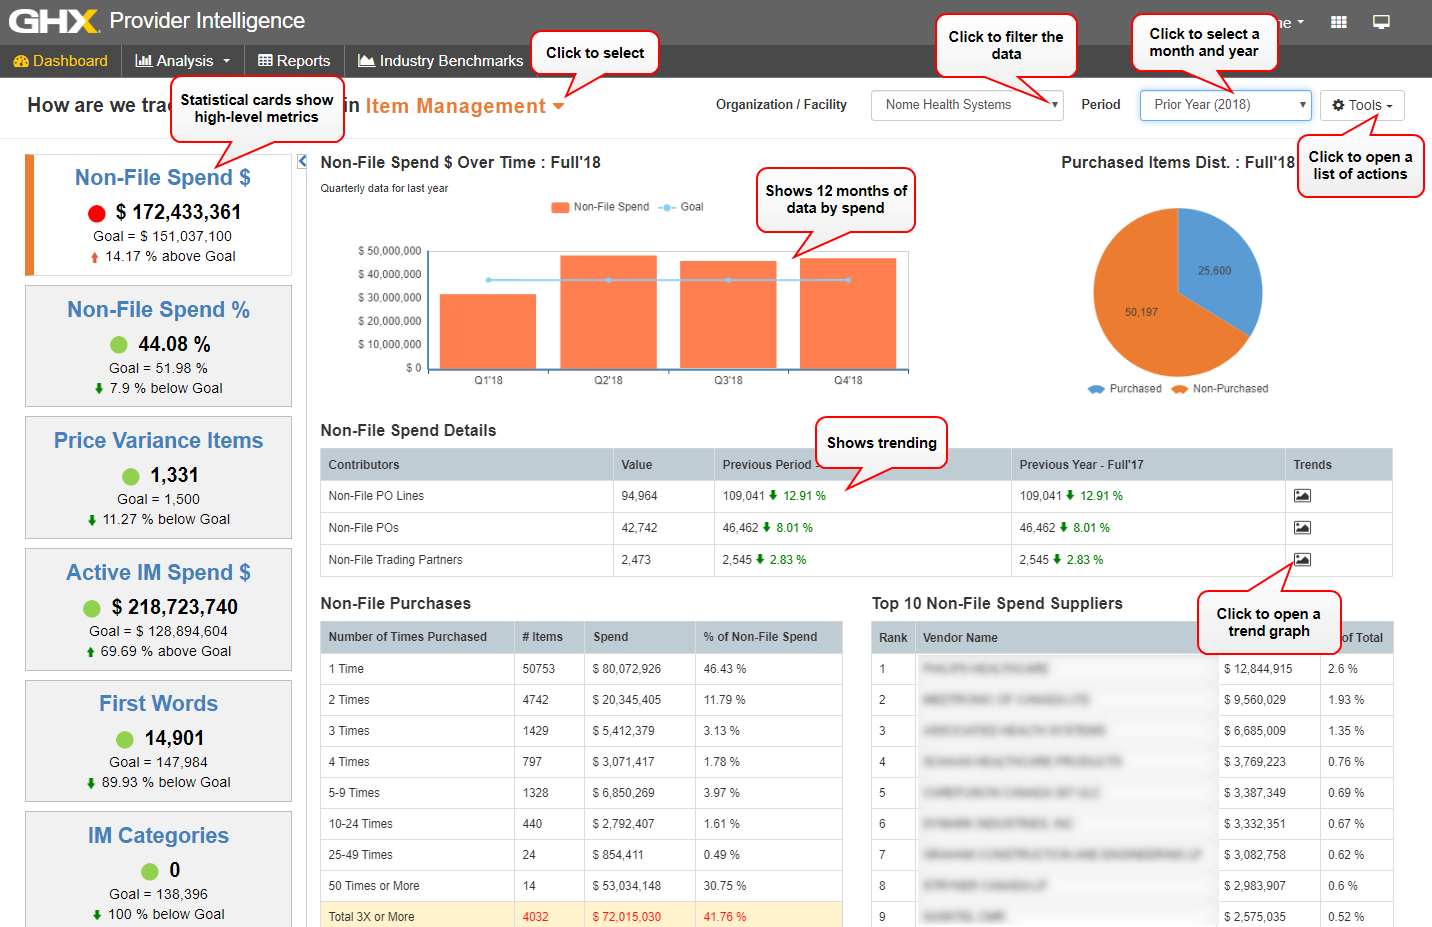
Contains the total dollar volume of all non-file spend order transactions sent across the provider's Exchange connection.
 Click the Non-File Spend $ statistical card to view the following information: Click the Non-File Spend $ statistical card to view the following information:
- In the Non-File Spend $ card:
- Purchase order volume for the selected time period
- The current goal in dollars
- Trend information based on numbers from the previous year
- In the Non-File Spend $ Over Time bar graph:
- A graphical representation of the purchase order volume over the past 12 months
- Click the Goal link to show a blue goal line on the bar graph; click again to hide the line
- In the Purchased Items Dist graph:
- The purchased and non-purchased spend in dollars
- On the Non-File Spend Details table:
- Detailed information about each contributor, including the contributor name, value, volume for the previous period, and the volume for the previous year
- Click the
 icon in the Trends column to open a graph that shows the data over time icon in the Trends column to open a graph that shows the data over time
- On the Non-File Purchases table:
- The number of times items were purchased
- The percentage of non-file spend
- On the Top 10 Non-File Spend Suppliers table:
- The dollar volume and percentage of the total spend broken out for each of the top 10 suppliers
|
| Non-File Spend %
|
Contains the total dollar volume of all invoice transactions sent across the provider's Exchange connection.
Click the Non-File Spend % statistical card to view the following information:
- In the Non-File Spend % card:
- The total invoice spend for the selected time period
- The current goal in percentage
- Trend information based on numbers from the previous year
- In the Non-File Spend % Over Time bar graph:
- A graphical representation of the invoice volume over the past 12 months
- Click the Goal link to show a blue goal line on the bar graph; click again to hide the line
- On the Purchased Items Dist table:
- The invoice spend in dollars (Purchased)
- Goal numbers for the year that were not yet spent (Non-Purchased)
- On the Non-File Spend % Details table:
- Detailed information about each contributor including the contributor name, value, volume for the previous period, and the volume for the previous year
- Click the icon in the Trends column to open a graph that shows the data over time
|
| Price Variance Items
|
Contains the percentage of PO lines that have an exception.
Click the Price Variance Items statistical card to view the following information:
- In the Price Variance Items card:
- Total number of exceptions
- The current goal
- Trend information based on the percentage from the previous year
- In the Price Variance Items Over Time graph:
- A graphical representation of the exception rate over the past 12 months
- Click the Goal link to show a blue goal line on the bar graph; click again to hide the line
- In the Price Variance graph:
- A graphical representation of the exception rate percentages
- On the Price Variance Details - Purchased with 3 or more prices for same UOM table:
- Detailed information about each contributor including the contributor name, value, volume for the previous period, and the volume for the previous year
- Click the icon in the Trends column to open a graph that shows the data over time
- On the Price Variance Items table:
|
| Active IM Spend $
|
Contains the percentage at which the part of a PO line matches a contract loaded into CCXpert.
Click the Active IM Spend $ statistical card to view the following information:
- In the Active IM Spend $ card:
- Total amount in dollars of the active IM spend
- The current goal in dollars
- Trend information based on the percentage from the previous year
- In the Monthly data for last 12 months graph:
- A graphical representation of the contract match rate over the past 12 months
- Click the Goal link to show a blue goal line on the bar graph; click again to hide the line
- On the Item Master Metrics table:
- The number of total item master items, new items, and inactive items
- On the Active Spend Details table:
- Detailed information about each contributor, including the contributor name, value, volume for the previous period, and volume for the previous year
- Click the icon in the Trends column to open a graph that shows the data over time
- On the Active IM Dist pie chart:
- A graphical representation of the number of active versus inactive items
- On the Top 10 Active IM Spend Suppliers table:
- The number of lines and percentage of total lines for each of the top 10 suppliers
|
| First Words
|
Contains the savings for your organization. This can be shown as a total of all products or by individual products.
Click the First Words statistical card to view the following information:
- In the First Words card:
- Total number of words saved during the selected time period
- The current word goal
- Trend information based on the percentage from the previous year
- In the First Words Over Time graph:
- A graphical representation of the first word match rate over the past 12 months
- Click the Goal link to show a blue goal line on the bar graph; click again to hide the line
- In the First Words bar graph:
- A graphical representation of the First Words versus Best Practice occurrences
- On the First Word Details table:
- Detailed information about each contributor, including the contributor name, value, volume for the previous period, and volume for the previous year
- Click the icon to open a graph of the data over time
- On the First Word Description table:
- Detailed information about first words, including item count, spend, and percentage of overall spend
- On the Item Duplication Examples table:
- Detailed information about each contributor, including the vendor name, buyer part number, UOM, number of duplicates, vendor part number, manufacturer part number, and descriptions
- On the Problematic First Words table:
- Detailed information about problematic first words, number of occurrences, item numbers, and sample descriptions
|
| IM Categories
|
Contains the GHX-estimated savings for your organization. This can be shown as a total of all products or by individual products.
Click the IM Categories statistical card to view the following information:
- In the IM Categories card:
- Total dollar amount of savings realized during the selected time period
- The current potential savings goal
- Trend information based on the percentage from the previous year
- In the Categories Over Time bar graph:
- A graphical representation of the contract match rate over the past 12 months
- Click the Goal link to show a blue goal line on the bar graph; click again to hide the line
- In the Category Opportunity bar graph:
- A graphical representation of the item management categories versus the available categories
- On the Category Details table:
- On the Top 25 Spend Categories for table:
- Select one of the following spend options:
- Total Spend
- Non-File Spend
- Non-File Percentage
- Non-Contract Match
- # of First Words
- Price Deviation
- On the Categorization Consolidation Opportunity table:
- A list of UNSPSC categories, codes, nouns, types, manufacturer names, annual spend, and percentage of spend
|