6-month Backorder Trend by Contract
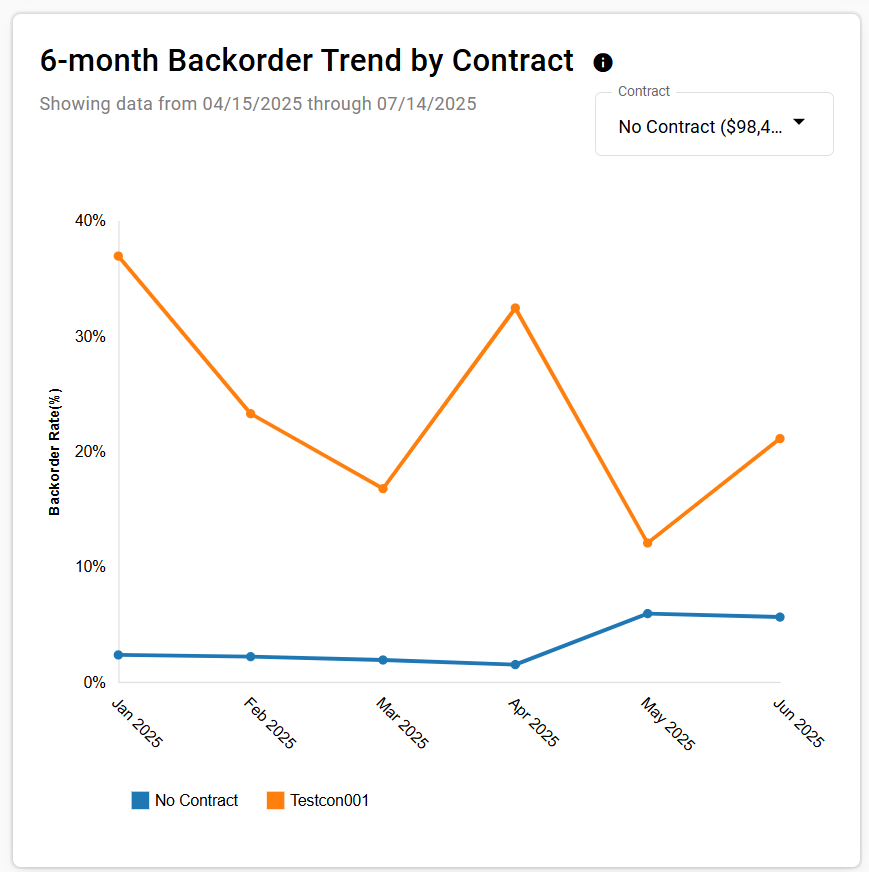
The 6-month Backorder Trend by Contract section visualizes the backorder trends over the past six months, broken down by contract. It helps identify patterns and fluctuations in backorders, aiding in strategic planning and supplier management.
Field Descriptions
The following fields appear in the 6-month Backorder Trend by Contract section of the Supplier Details screen.
| Field | Field Description |
|---|---|
|
Contract |
By default, all contracts associated with this supplier are displayed on the graph. To filter the graph based on specific contracts, select the contracts you want to view information for in the Contract drop-down and then select away from the drop-down to enact the filtering. |
| Backorder Rate |
Indicates the backorder rate percentage for a contract. |
| Time (month and year) |
Indicates the month and year that corresponds with the backorder rate percentage for a contract. |
| Graph legend | Indicates the color/supplier combination used in the graph. |
| Details |
Hover over any point in the graph to view the following details:
|