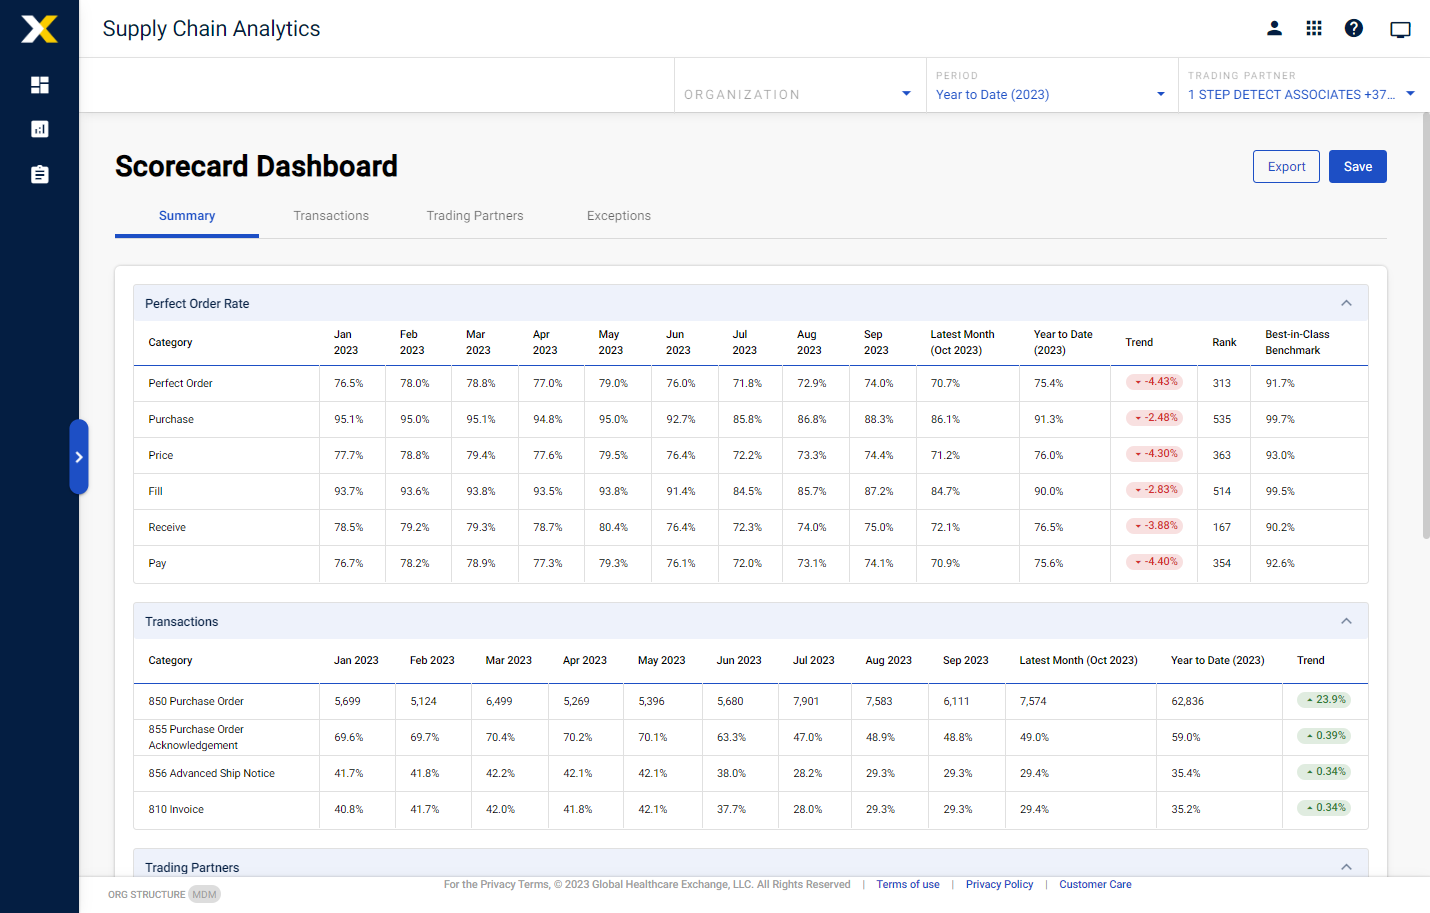
Scorecard Summary Tab

This Scorecard Summary tab provides a full summary of all key metrics across the Supply Chain Analytics scorecard in a single view for easy comparison across tabs.

Metric Description
Perfect Order Rate

Includes the following breakdown:

  • Perfect Order rate

  • Purchase rate

  • Price rate

  • Fill rate

  • Receive rate

  • Pay rate

Transactions

Includes the following breakdown:

  • 850 Purchase Order – The number of PO lines across all channels

  • 855 Purchase Order Acknowledgement – The percentage of PO lines with an 855 (POA utilization rate)

  • 856 Advanced Ship Notice – The percentage of PO lines with an 856 (ASN utilization rate)

  • 810 Invoice – The percentage of PO lines with an 810 (invoice utilization rate)

Trading Partners

Includes the following breakdown:

  • Integrated – The number of trading partners with an integrated transaction

  • GFax – The number of trading partners with a G-Fax transaction

  • Metatrade – The number of trading partners with a MetaTrade transaction

  • New Registrations – The number of new trading partners that were registered in GHX Registration Center

  • TradingNet – The number of trading partners with a TradingNet transaction

  • WebDirect – The number of trading partners with a WebDirect transaction

Exceptions

Includes the following breakdown:

  • Price – The price exception rate

  • Part Number – The part number exception rate

  • UOM – The unit of measure exception rate

  • Back Order – The backorder exception rate

  • Rejected – The rejected exception rate

  • Quantity – The quantity exception rate

  • Deleted – The deleted exception rate

  • On Hold – The on hold exception rate

Metrics based on selected time period

The following are examples of how data is displayed related to time:

  • Columns show metrics broken out at monthly level based on the selected time period

  • Columns show metrics at an aggregated time period level (for example, the "Last 12 Months")

  • Columns show metrics at an aggregated year to date (YTD) level in the current "Year to Date" column

  • "Trend" reflects the month-over-month comparison of most current data to previous data.