Scorecard Trading Partners Tab
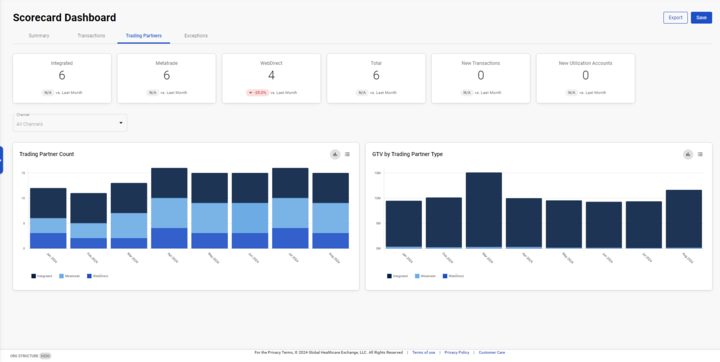
The Scorecard Trading Partners tab shows the count of trading partners across each channel that have had volume over the selected time period. You can also see new trading partner registrations and transaction activity from GHX Registration Center.
Note: The dashboard will show only those pertinent channels that align with your organization's data. For example, if you have GHX transactions that span across only Integrated and G-Fax, only those channels will be shown on the scorecard.
| Card | Description |
|---|---|
| Integrated | The total number of integrated trading partners that have activity during the selected time period. |
| GFax |
The total number of unique trading partners that transacted using G-Fax during the selected time period. |
| Metatrade |
The total number of unique trading partners that transacted using MetaTrade during the selected time period. |
|
TradingNet |
The total number of unique trading partners that transacted using TradingNet during the selected time period. |
| WebDirect |
The total number of unique trading partners that transacted using WebDirect during the selected time period. |
| Total | The total number of unique trading partners that transacted during the selected time period. |
|
New Utilization Accounts |
Trading Partners that have had a New PO Transaction (850 Only) on the Exchange. This metric compares the first PO Transaction date between Trading Partners against the Period Filter selected in Scorecard to determine if it is net new or not. Note: New Trading Partners are the Supplier Parent Grain. |
| New Transactions | The total count of POs from newly registered trading partners that occurred during the selected time period. This metric compares the first PO Transaction date between Trading Partners against the Period Filter selected in Scorecard to determine if it is net new or not. |
|
Percentage change on each card |
The percentage change from the previous month. |
| Graphs |
The Trading Partner Count graph on the left is a stacked bar chart showing the trading partner counts by selected channel. The Gross Transaction Volume (GTV) by Trading Partner Type graph on the right is a stacked bar chart of trading partner gross transaction volume. Tip: Click the icons to toggle between the graph |