Dynamic Reporting
Overview
Dynamic reporting cross-joins data attributes across multiple datasets to create a true custom report. These reports use grouping and sorting to create more granular aggregated reports. All dynamic reports can be filtered, saved, and scheduled using SCA reporting features.
What make Dynamic Reporting different than the current SCA Reporting Library?
-
The ability to join fields across existing reports to create a custom report.
-
Enhanced report-level Filtering options that allow for both And/Or operators.
-
Sorting and Grouping features to better structure the report and create column aggregations.
If you prefer to watch a video, you can refer to How to Create Custom Reports With Dynamic Reporting. This video teaches you how to create a custom report to:
-
Consolidate critical GHX transaction data
-
Monitor PO status
-
Analyze trading partner performance
-
Identify opportunities for improved supply chain efficiency
How to Access Dynamic Reporting
From the left-hand main menu, choose Dynamic Reporting. (See Below):
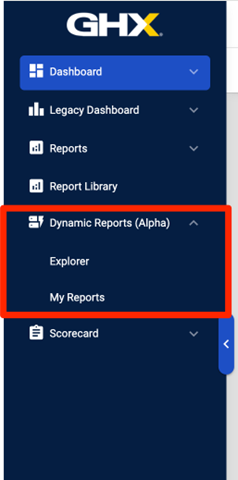
Explorer
This is the main Dynamic Reporting page where you can select your dataset or datasets that you want to work with then choose the columns you want on your report.
You will be able to choose from the following datasets:
-
PO Details
-
POA Details
-
ASN Details
-
INV Details
-
Exception Details
-
Transaction History
-
Perfect Order Exception Details
You can select one or multiple columns across each dataset to have on a single report. By default the main dataset select includes the default fields for that report.
Report Pick List
MAIN – Is your base dataset or your starting point.
JOIN – The data sets that you want to join to your main dataset.
Tip – To maximize your dataset it is generally a best practice to use PO Details as your main table. This is because most PO lines have a PO. If you start with an invoice as your main then join PO data then you are only getting PO data that has an Invoice.
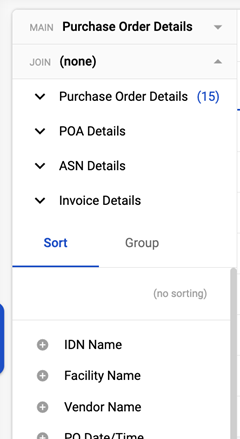
Using The Pick List
After the MAIN is selected, you can pick from the remaining datasets to add attributes. Each attribute is tied to a business transaction line ID that GHX uses to track the line across each of the core 4 docs to identify updates and exceptions.

Once the desired attributes have been selected, click run to view your report or move to the Sorting or Grouping section.
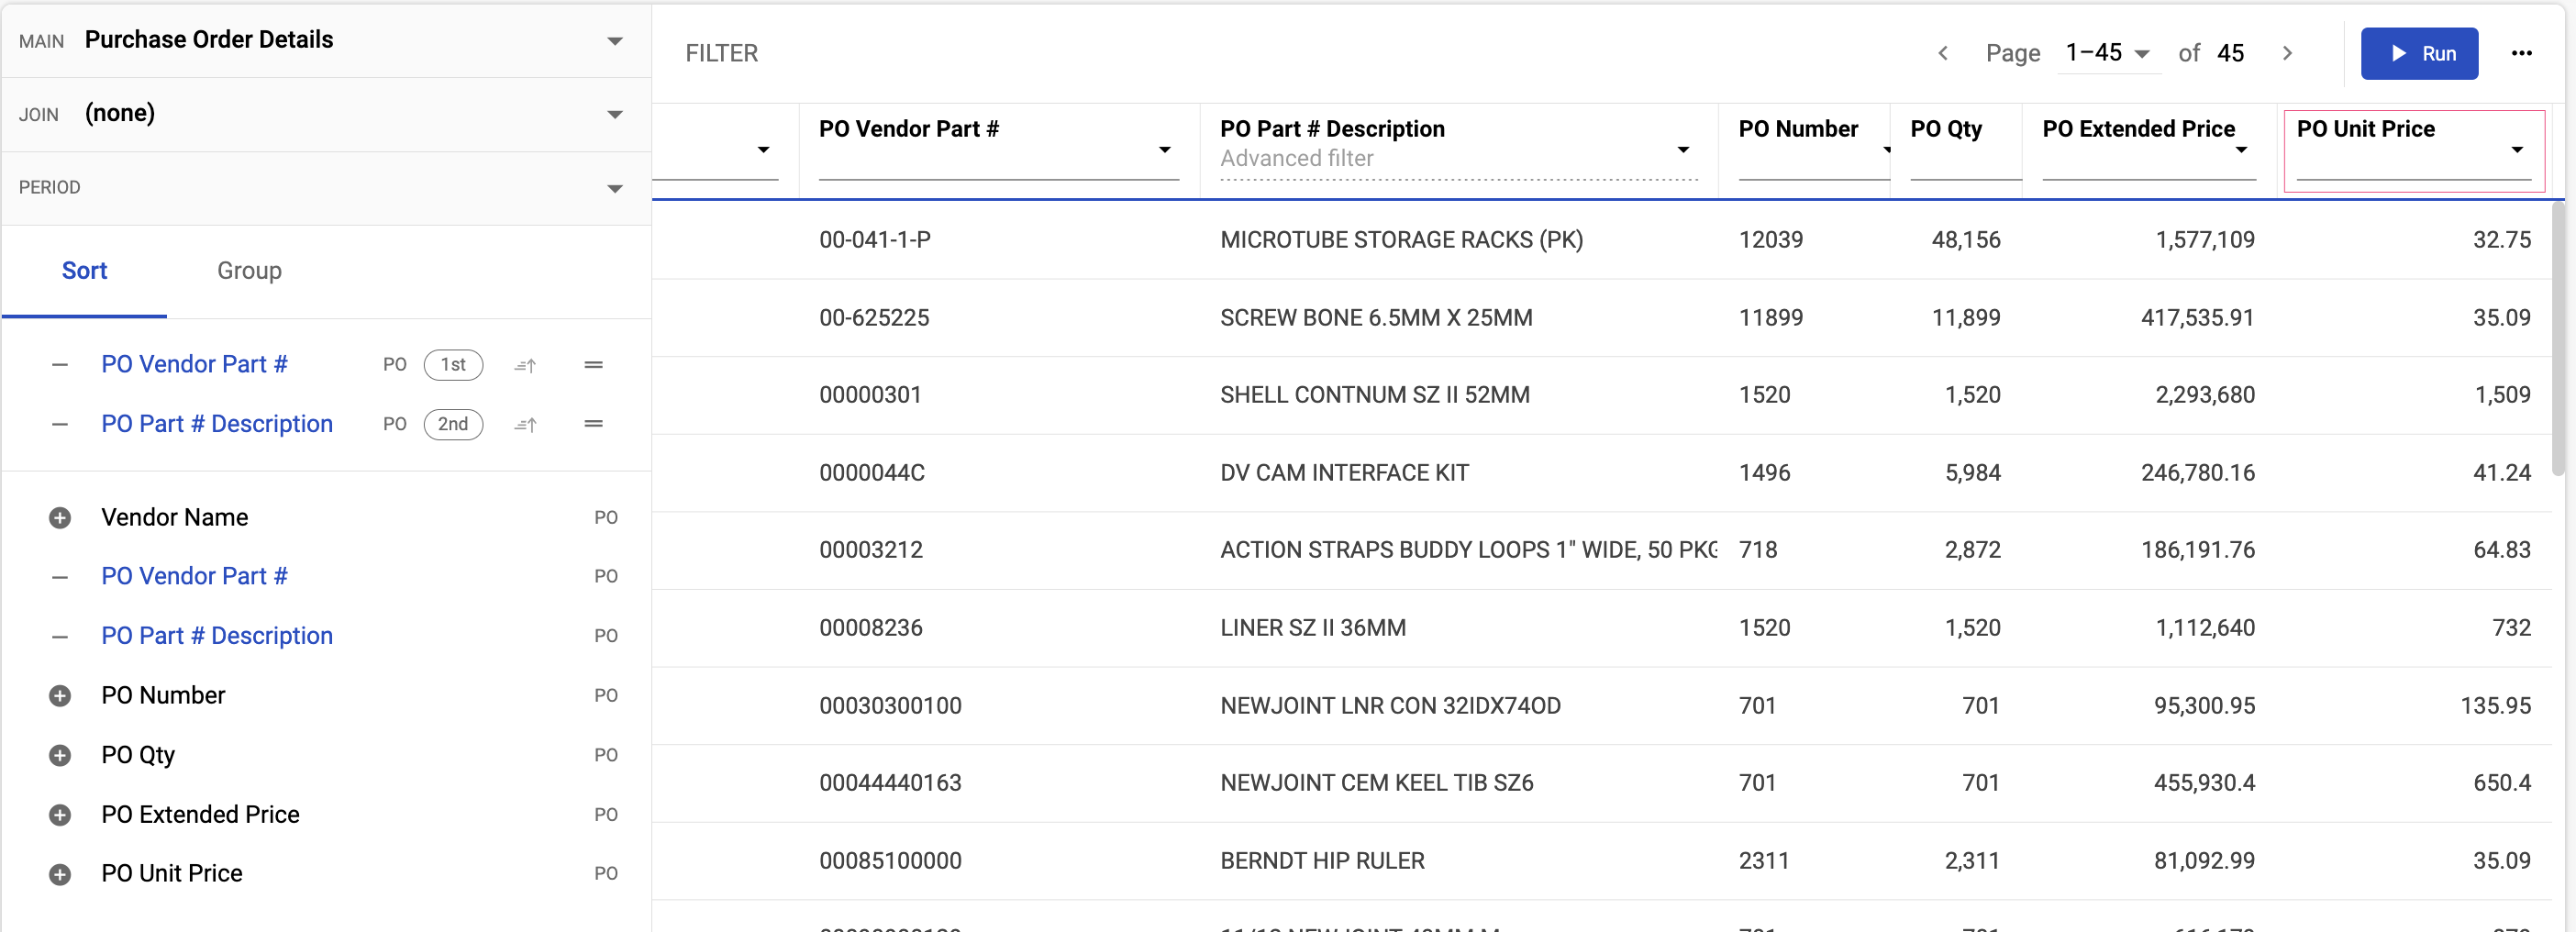
Sorting
Dynamic reporting allows users to better control of how to sort reports by allowing the sorting by multiple columns and a separate interface to manage the sorted columns.

The UI shows the order of the sorted columns and provides the option to change the order. There is also an indicator to allow for sorting by ascending or descending.
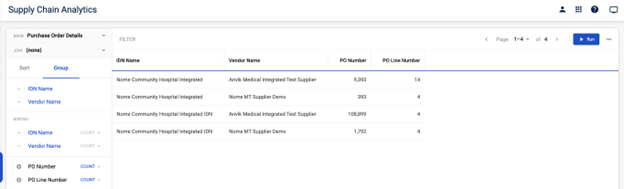
Grouping
The grouping feature provides the ability to choose specific attributes as your grouped columns allowing for aggregations to the data. This expands the report from line level data to aggregations like counts and sums.
Example:
Aggregation Options
| Option | Definition |
|---|---|
| COUNT | Column values are counted when aggregating. |
| SUM | Column values are summed when aggregating (quantitative only). |
| MIN | Minimum value is picked when aggregating (quantitative, ordinal only). |
| MAX | Maximum value is picked when aggregating (quantitative, ordinal only). |
Tip – When using grouping pay attention to the columns you want to group by and remove any unneeded columns from the report where the aggregations may not make sense.
Column Filtering
Dynamic Report Column Filters
- Each column header provides an advanced, column-level filter.
- The filter options for each column corresponds to the column type (Text, Number, Date).
- User-selected filter values are saved with the report and are restored upon reloading the report.
- Reports with column-level filters and no joining, grouping, or advanced filtering are expected to yield rows exactly like native reports.
Column Filtering with Grouping
- Adding grouping columns to the report changes the behaviour of column-level filters.
- Column-level filters are applied post-aggregation, so non-grouped columns (i.e., aggregated columns) will provide filter options corresponding to the columns' chosen aggregation type.
For example, the column "Facility Name" is textual, so text-based filter options are provided. However, if the report is grouped by column "IDN Name", then "Facility Name" defaults to a COUNT aggregation. COUNT is numeric, so the text-based filter options for "Facility Name" are replaced with numerical filter options.
- When columns are selected for grouping, any existing column-level filters will persist (even if the filter is no longer valid). If a column does not have an existing filter applied, it will automatically change its filter options to align with the column's chosen aggregation.
- When the "Run" button is pressed, the report engine will validate each column-level filter. If one or more filters are no longer valid after grouping (e.g., a text-based filter is applied to an aggregated COUNT column), then a warning dialog appears to notify the user of the invalid filters.
From the dialog, the user has the option to A) cancel the query or B) remove the invalid filters and continue the query.

Advanced Filtering
Advanced Filtering provides a SQ L-like interface for defining column and filter values. This open text filter allows for more flexibility from full report filtering than column. For example, you can use both ‘And’ and ‘Or’ logic to further filter down a dataset. You can also use simple arithmetic and equality functions like (less than/greater than).
Example Operators:
-
Logical
-
OR ("or”)
-
AND ("and”)
-
-
Equality
-
Equal ("="),
-
Not Equal ("!=),
-
Greater Than (">"),
-
Greater than or Equal (">="),
-
Less Than ("<"),
-
Less Than or Equal ("<="),
-
IN ("in"),
-
-
Arithmetic
-
ADD ("+"),
-
SUBTRACT ("-"),
-
MULTIPLY ("*"),
-
DIVIDE ("/"),
-
Advanced Filtering Example
Tip – When adding columns to the advanced filter, you can hover over the field in the pick list to view the full attribute name. Then add that name to the advanced filter with the operator and values to complete your filter.
Exporting and Saving Reports
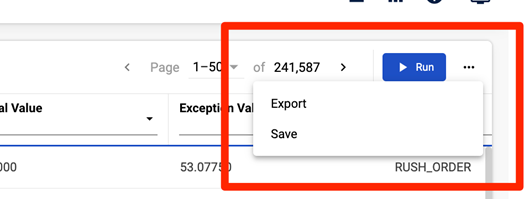
Clicking on the menu next to the run button, shows the drop-down allowing users to Export or Save the report they created.
Exporting
When selecting export a pop-up menu will appear and ask for the following inputs:
-
Report Name
-
Free text field to name report
-
-
Export File Type
-
CSV
-
Tab
-
Pipe
-
Excel

-
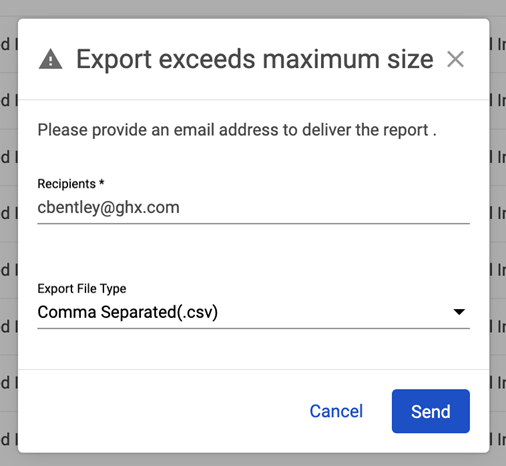
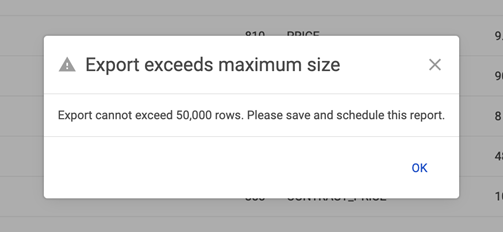
The file will auto download on the browser if it is within our size thresholds of being under 50,000 records. If the report is over 50,000 records, then you see the pop-up below and is prompted to save/schedule the report.
Saving
When saving a report, a pop-up will be shown that will allow the user to name the report and add a description to the report.
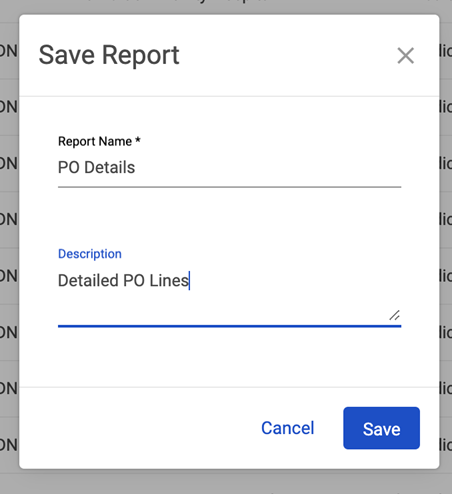
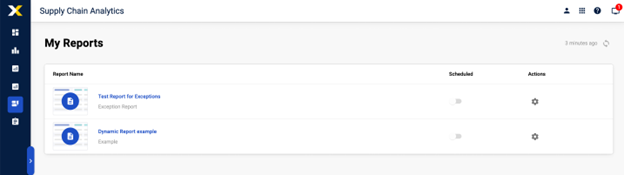
The saved report will now appear under My Reports where it can be scheduled.
Scheduling
Refer to Scheduling Reports to add your Dynamic Report to a schedule.